16 May 2017
How did your crop perform today?

The aim of all growers is to produce the best quality product, in maximum quantities, at the right time and with as few resources as possible. Tracking daily crop performance is the key to producing maximum yields. To monitor crop performance , Ridder has developed its unique ProDrain system that determines the actual crop growth rate by measuring the increase in fresh weight.
The system continuously weighs eight square metre of crop plants (86 square feet). A sophisticated computer algorithm recognizes disturbances in the weight and filters out even the smallest variations caused by harvesting events, de-leafing or other crop work. What remains is a direct measurement of the crop’s growth rate (g/m²/h), the cumulative fresh weight increase (kg/m²) and the total weight increase per day (kg/m2/day). The fresh weight increase per week provides essential input for yield forecasting. Tomato crops require approximately four weeks of growth before producing harvestable yields.
Plant load
The trend in crop weight during the season provides invaluable insight into the crop’s development. Just by examining the plant weight over longer periods and comparing it with previous months or the previous year, we can see clearly how the plants are developing , i.e. if the plants are growing or not.
The graphs below shows the rise and drop in fruit load on the plants and the effect it has on the total plant weight over 6 months. It is clearly visible in the graphs of each one month that the young plants are gaining weight in April and October, in May harvesting and growth are in balance, in June, July and August the plants are losing weight.
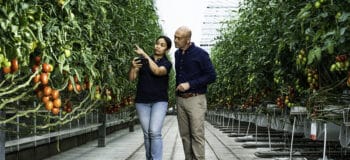
Experience from the field
Paul Selina from Village Farms, an experienced ProDrain user over seven years, uses plant weight and growth numbers almost every day. Paul explains: “the weight measurements of the plants tells me a great deal. Firstly, disturbances in the daily growth curve can indicate periods of stress and then recovery during the day. We have adjusted our watering, ventilation and screening strategies from what we have learned from the shape of the daily cumulative growth.
Secondly, the total growth for the day, kg/m2/day, tells us a lot about how well the crop is growing. We look at these daily totals and compare them to the data of previous crops at the same stage of growth as an indicator whether the production in a month’s time will be higher or lower than normal. We see that the daily growth does not depend on the Joules for that day, but that growth and development seems to be a function of the amount of ‘reserve’ in the plant and the average 24hr temperature.
Thirdly, we look at the total crop weight, kg/m2, when it is higher than normal it obviously tells us that we will harvest more fruit in the coming weeks, and we may be able use to higher temperatures to influence exactly when we pick them. Conversely, a lower crop weight is an indicator that we need to cool down, rebuild the fruit load, and prepare for a lower forecast in the coming weeks.
How quickly the crop is ‘loading’(increasing in weight) has implications for short-term forecasting. Sometimes you will have a week with lower than expected production, but if the crop weight has increased more than expected, then that will indicate that next week’s production will be higher. If this week’s pick was higher than expected, but total crop weight did not increase, then next week’s pick will be lower. A similar dynamic applies at times of ‘unloading’.
We know that there is much more to learn from our ProDrain crop weighing system, especially when we can compare measurements from two ProDrains and can quickly see the impact of different trials and strategies.”
Waves of growth
The increase in plant weight is far from stable over the day. At night, there is a balance between water uptake and transpiration. As the sun is coming up, plant activity increases and growth speeds up. At midday, the plants tend to lose more water than their roots can absorb . Once noon has passed, the plants recover and growth rates go up again. Later, as solar irradiance drops, plant activity goes down again. If we put this data in a graph , it shows up as a set of waves. In the graph below, you can see 5 consecutive days combined.
Growth rates (wave pattern) and the cumulative growth (lines increasing). This data was measured in an elevated area with virtually cloudless skies. Whether this wave pattern less than optimal is unclear; we see the same pattern recurring with crops around the world. Most growers prefer some variation since variation in growth rate is also a generative strategy. The amplitude of the ‘waves’ is an important indicator. The general opinion is that if the waves are too large, the plants are experiencing stress and not producing the best possible yields.